
App Store Conversion Rate
Understanding App Store Conversion Rate for Google Play & Apple Play Store
App Store conversion rate is the ratio of total downloads of that app to the total store listing visitors or product page views of the app.
App store conversion rate = Total App downloads / Total Product page views
In the iOS (App Store Connect), it is called product page views; In the Android (Google Play Console), Product page viewers are called Store Listing Visitors. We should note that in the iOS Appstore connect, we get a conversion rate metric in the app analytics section. This metric shouldn’t be considered for app conversion rate as it uses app icon impressions instead of product page views. In the above formula product page views is replaced with app icon impressions in the denominator
The app icon impression is a top-of-the-funnel number generated on three instances in the App Store & Play Store.
When the app shows up in the search result
When the app shows up in the similar apps section of the other apps
And in the Discover section, which includes New apps, Top apps, Editor choices, etc.
So using them to measure the app’s conversion rate is wrong. It is like calculating the website conversion rate by dividing total leads by the Ad and organic impression. On the contrary, the conversion rate in the Google Play Console, named “Store listing conversion rate,” measures the app install conversion rate properly.
Sources of App Store and Play Store Traffic
There are five primary traffic sources in App Store and Play Store. However, they are named differently in the App Store Connect (iOS) and Play Console differently.
In the Play console, the traffic sources are broadly classified into three buckets.
Third-party Referrals
Google Play Search &
Google Play Explore
Here the third-party referrals will be further drilled down to Google, Facebook, and other media sources. You can also get the traffic data at the campaign level here, but it is usually not accurate.
In iOS, the traffic sources are classified into five buckets.
App Store Search - This includes traffic from organic search & Apple search ads.
App Store Browse - This is equivalent of Google Play Explore
Web Referrer - Traffic from any website, including the brand’s own website
App Referrer - Traffic from any other apps
Unavailable - Traffic that is not categorized
One important thing to note here is that when we look at the unique device level, product page views by traffic sources will be under-reported while the data is accurate at the overall level.
How to get the Conversion Rate data in the App Store ?
You can get the app store conversion rate directly in the Google Play console, while in the iOS AppStore connect, you have to calculate it using two available metrics. As mentioned earlier, the default conversion rate metric in the App Store Connect is not correct.
App conversion rate Benchmarks for Android
In the Google Play console, you can get the data by clicking the Grow section on the left side of the dashboard, followed by Store Performance and Conversion Analysis.

App Conversion in Google Play Console
In this dashboard, you get three metrics.
Store Listing Visitors
Store Listing Acquisition &
Store Listing Conversion Rate
Along with the app's store listing conversion rate, you will also get the median store listing conversion rate of the peer apps by app category. This metric is handy for comparing your app's conversion rate performance with similar apps.
Unlike Play Console, you won't get detailed benchmark data for iOS in the App Store Connect analytics. While you get benchmark conversion rate data for your app category alone), even that conversion rate benchmark is less valuable as it is calculated with App icon impressions as the denominator.
On top of this conversion rate metric is available for the below dimensions in the Play console.
Country/region
App install state - New or reinstall
Language
Search term
Store listing
Traffic source, UTM campaign & UTM source
App conversion rate Benchmarks for iOS or Apple
In the iOS App Store connect, you must compute the App conversion rate using the two available metrics - Total App downloads &Total Product page views.
An important point to note here is that we use this product's page views to calculate the overall views, not the unique views. While you get unique Product page views data in the App Store Connect metric tab, that data is often under-reported and should be avoided for calculating the conversion rate. On the contrary, this number conversion rate data available in the Google Play Console is unique at the user level.
You can calculate the iOS app's conversion rate by the below dimensions, too, as both product page views and app download data are available in the following dimensions.
Location
Traffic source
Device
Platform version &
Page type
App Store Conversion Rate by Categories
You can find the median App Store conversion rate benchmark for all the top app categories (for Android) below. Along with it, you can also find the median conversion rate for the top 25 percentile of the apps and the top 75 percentile of the apps in each of the categories below.

App Category & Average App Conversion Rate

Average App Conversion Rate For Different App Category
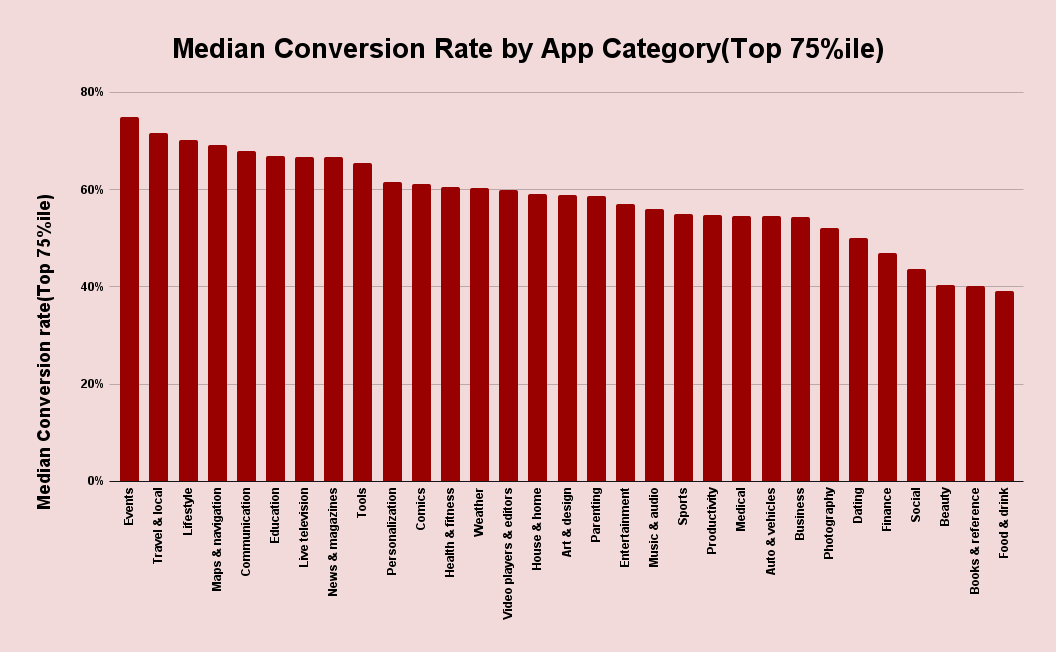
Average App Conversion Rate for Different Sectors - Top 75%ile

Average App Conversion Rate for Different Sectors - Top 25%ile
What is a Good App Store Conversion Rate?
To arrive at a good app store conversion rate is important to understand few salient characteristics of the App Store conversion rate in Android. Most of them are applicable to iOS as well. However, we can’t get the data for all of them in iOS App Store Connect.
Store visits to App Install conversion rate usually range between 30-60% for most apps.
At the aggregate level, returning visitors to the product page convert ~2x higher than new visitors.
Search visitors convert ~3-4x higher than visitors who come via Play Store Explore or App Store browse
Paid traffic converts ~50% lower than the organic visitors initially, but this number drops further with scale & channel expansion.
Another important characteristic of the App Store Conversion Rate metric is that it helps in figuring out App install fraud when running campaigns with affiliates & Add networks.
For example, if any media source(Ad network) gives less than 1% of click-to-install conversion, you should know that something is fishy with the traffic. Even important data to check is the campaign’s ad clicks to store listing visitors correlation.
If you get 100 clicks in your mobile measurement platform(MMP) dashboard and not even 50 store listing visitors(lift) in the Play console, then you can deduce that those clicks are mostly fraud.
You can also show this data to affiliate/Ad network partners as proof of click fraud happening in their campaign.
Today, mobile Apps have replaced websites as the most user-preferred platform for all top tech companies. Hence, most brands invest in building very sophisticated analytics to understand user behavior leading to conversion after the user installs the App.
However, neither the product nor the marketing team spends time and effort in understanding how user conversion happens before the App is installed.
If not on a daily or weekly basis, the growth team should check the app conversion rate once or twice a month. This improves their marketing efficiency and user growth to a large extent.
FAQs On App Store Conversion Rate
-
App store conversion rate is the ratio of total app downloads to the total number of store listing visitors or product page views of the app. It is calculated as Total App downloads divided by Total Product page views.
-
In iOS (App Store Connect), it's called product page views, while in Android (Google Play Console), they are referred to as Store Listing Visitors. However, it's important to note that the iOS App Store Connect metric uses app icon impressions instead of product page views for conversion rate calculations.
-
App icon impressions occur at various stages in the App Store and Play Store and do not accurately represent the conversion rate. It's akin to calculating website conversion rates using total leads divided by ad and organic impressions.
-
There are five primary traffic sources in the App Store and Play Store, with different categorizations in iOS and Android. These sources include Third-party Referrals, Google Play Search, Google Play Explore, App Store Search, App Store Browse, Web Referrer, App Referrer, and Unavailable.
-
In the Google Play Console, you can directly access app store conversion rate data. In the iOS App Store Connect, you need to calculate it using the available metrics, Total App downloads, and Total Product page views, as the default conversion rate metric is not accurate.
-
In Google Play Console, you can find benchmark data for app conversion rates under the "Grow" section, specifically in the "Store Performance" and "Conversion Analysis" subsections. This data includes metrics like Store Listing Visitors, Store Listing Acquisition, and Store Listing Conversion Rate.
-
Unlike the Play Console, detailed benchmark data for iOS is not readily available in the App Store Connect analytics. Even the conversion rate benchmark provided is less valuable as it uses App icon impressions in its calculation.
-
Several factors affect the app store conversion rate, including the type of traffic source, returning visitors, search visitors, paid traffic, and the potential for click fraud in campaigns with affiliates and ad networks.
-
App Store conversion rate metrics can help identify app install fraud when running campaigns with affiliates and ad networks. Suspiciously low click-to-install conversion rates can indicate fraudulent activity, and the correlation between ad clicks and store listing visitors is essential to monitor.
-
It is advisable for the growth team to check the app conversion rate once or twice a month. This practice enhances marketing efficiency and user growth, helping brands understand user behavior leading to conversion before the app is installed.